
Want to read more? Click here for more Well Insights.
PRIMARY PRESSURE DERIVATIVE
In well test analysis, the use of type curves and derivatives is a common technique to help identify various flow regimes in the wellbore, as well as determine when wellbore storage has ended. Generally speaking, the goal of a well test is understand things about the reservoir, and the well’s interaction with it, that we cannot see or measure directly, such as permeability, skin, and reservoir boundaries. While we are focused on the reservoir for the purpose of our analysis, our data can be impacted significantly by things that happen in the wellbore, and are therefore non-reservoir related. Furthermore, it can be it can be very difficult to tell the difference between wellbore-related effects and reservoir-related effects and confusing the two can significantly skew the analysis. Being able to accurately identify wellbore-related effects is critical for an accurate well test analysis.
Examples of some wellbore-related effects in a well test include:
Liquid influx
Gauge malfunction
Phase redistribution in wellbore
This brings us to the “Primary Pressure Derivative”.
The Primary Pressure Derivative (PPD) is a simple technique that we developed by Fekete Associates (now IHS Markit) and published in a paper in 1992 (you can find the paper here). In their paper they discuss a very simple, yet powerful method for identifying wellbore-related effects. This is done simply by calculating the true mathematical derivative of pressure data (dP/dt).
Before we move further, we need to clarify the difference between the primary pressure derivative and the “derivative” that we think of in a typical typecurve analysis. Let’s take a moment to understand the elements of a typecurve.
A typical typecurve is made up of two curves: a ΔP curve and a derivative curve. The ΔP curve is developed simply by calculating the net pressure difference over time, from the beginning of shut-in [ΔP/Δt]. The derivative therefore comes as the change in the ΔP curve [d(ΔP)/d(Δt)]. There are slightly difference variations of this method, some including pseudo-pressure (ψ) instead of pressure, but they all represent some form of ΔP/Δt. When graphed together on a log-log plot it looks something like this:
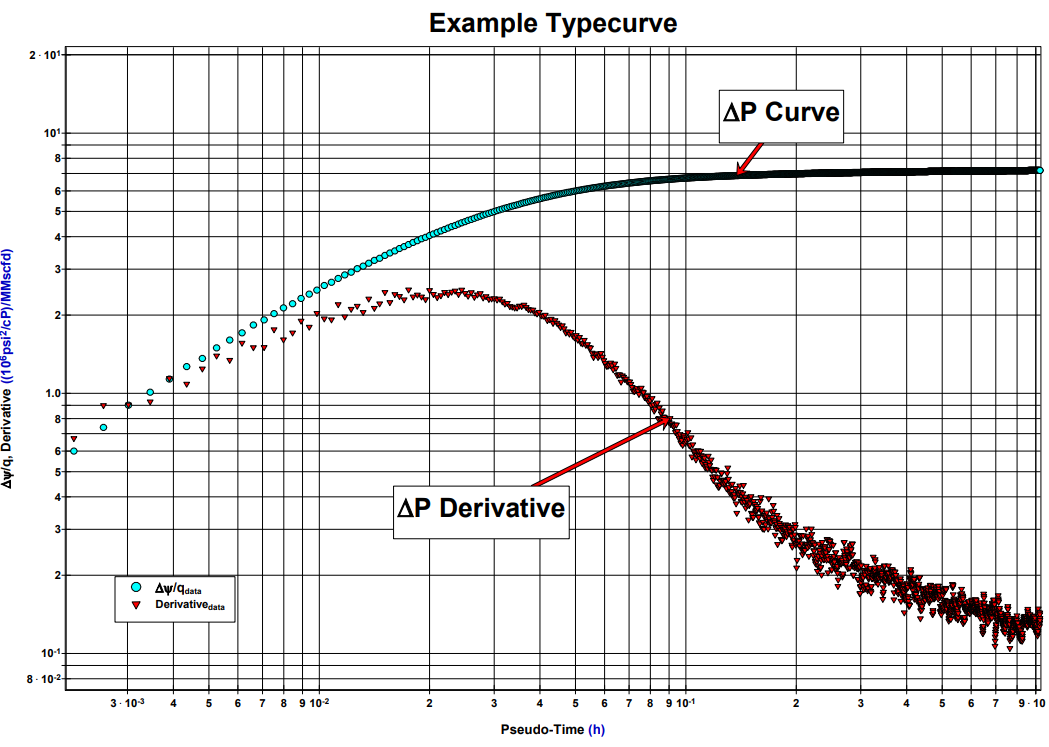
Typecurve plot created out of buildup data
Delta P and delta time is calculated from beginning of buildup to create typecurve plot
In order to not confuse the two, we will refer to the traditional typecurve derivative as the “ΔP derivative” and the primary pressure derivative as the PPD. As you can see, the ΔP derivative above is not a true derivative of pressure over time, but rather it is the derivative of ΔP/Δt. The PPD is truly the derivative of pressure over time (dP/dt). This may seem like a small difference but in fact they look very different on a graph, and they tell us very different things about the data.
The graph below shows how the PPD and the ΔP derivative compare:

Typecurve plot with PPD added - notice that PPD is always decreasing, indicating only reservoir-related effects and no wellbore-related effects
So with all this said, what is the value of the PPD? The ΔP derivative is very useful for identifying flow regimes (radial, linear, spherical, etc.), but the problem is that it has a very difficult time differentiating between reservoir and wellbore-related effects. In Fekete’s paper (linked above), they show an example of two different well tests with nearly identical typecurve plots. One of those plots has only reservoir-related effects while the other was influenced by wellbore-related effects. The traditional typecurve plots could not differentiate between the two cases, but the PPD clearly identifies which situation has wellbore-effects, and which one has only reservoir-effects.
So, without further ado, here is the grand summary of PPD:
Reservoir-related effects will always cause the PPD to decrease or stay flat, never increase. If the PPD is shown to increase, that is caused by wellbore-related effects. If you are analyzing a well test and trying to diagnose an unusual typecurve, look to the PPD to help steer your diagnoses. If PPD is decreasing over the course of the event, you know your issues are happening out in the reservoir. However, if you find your PPD increasing, you know you have things happening either in your wellbore, or perhaps with your measurement tools.
At FyreRok we specialize in helping our clients design, execute and analyze their well tests. Are you interested in learning how FyreRok can help you with your next well testing project? Contact us here, or for more information about FyreRok well testing, click here.